 Source code editor
Website development
Source code editor
Website development
|
|
Network Performance ProblemsNetwork performance problems are problems that cause your network to respond slowly. Because TCP/IP protocols commonly use TTL (Time to Live) settings limiting the age of a packet on the network, slow performance can cause lost packets and therefore loss of connectivity. Even if you don't lose connectivity, slow network performance can be an irritation and a source of lost productivity. A common cause for poor network performance is excessive traffic. Your network might be experiencing heavy traffic because there are too many computers on the network, or the cause might be a malfunctioning device such as a network adapter creating unnecessary traffic on the network in what is known as a broadcast storm. Sometimes the cause for poor network performance is a downed router that has stopped forwarding traffic and caused a bottleneck somewhere else in the network. TCP/IP offers a number of utilities that let you see where packets are going and display statistics related to network performance. The following sections discuss these utilities, which will help you find answers to problems related to network performance. TracerouteThe traceroute utility is used to trace the path taken by datagrams as they travel from your computer through multiple gateways to their destinations. The path traced by this utility is just one path between the source and destination; there is no guarantee or assumption that datagrams will always follow this path. If you are configured to use DNS, you can often determine the names of cities, regions, and common carriers from the responses. traceroute is a slow command; you need to give it approximately 10–15 seconds per router. Traceroute (or tracert if you are using Windows NT/2000/XP) makes use of the ICMP protocol to locate each router that stands between your client computer and the destination computer. The TTL value tells you the number of routers or gateways that a packet has passed through. By manipulating the TTL value that is used in the original outgoing ICMP Echo message, traceroute is able to find each router along the path, as follows:
In addition to locating each router or gateway the datagram travels through, the traceroute utility also records the round-trip time that it takes to reach each router. Depending on the implementation, traceroute might actually send more than a single Echo message to each router. For example, in the Windows 2000 version of this utility (tracert), two additional Echo messages are sent to each router so that it can better judge the round-trip time. However, you shouldn't use this round-trip time value to judge your network's performance precisely. Many routers simply give a lower priority to ICMP traffic and spend most of their processing time forwarding more important datagrams. The syntax for the traceroute command is simply traceroute followed by an IP address, a DNS name, or even a URL:
traceroute 198.137.240. 91
traceroute www.whitehouse.gov.
Traceroute is useful for showing you the path a datagram traverses on the way to its destination. Traceroute can also provide some diagnostic capabilities. routeAs you learned in Hours 9, "Network Hardware," and 10, "Routing," each computer and each router contains a routing table. Most routers use special routing protocols to exchange routing information and dynamically update their tables periodically. However, there are many times when it is necessary to add entries manually to route tables on routers and host computers. The route command has many uses in TCP/IP networking. You can use route to display the routing table in cases where packets from a host are not being routed efficiently. If the traceroute command reveals an abnormal or inefficient path, you might be able to use route to determine why that path is being used and possibly to configure a more efficient route. The route command is also used to add, delete, and change entries in routing tables manually. Some options include the following:
NetstatThe netstat utility displays statistics related to the IP, TCP, UDP, and ICMP protocols. The statistics display numerical counts for items such as datagrams sent, datagrams received, and a wide variety of errors that could have occurred. You should not be surprised if your computer occasionally receives datagrams that cause errors, discards, or failures. TCP/IP is tolerant of these types of errors and automatically resends the datagram. Discards occur when a datagram is delivered to the wrong location. If your computer acts as a router, it will also discard datagrams when TTL reaches zero on a routed datagram. Reassembly failures occur when all the fragments fail to arrive within a time period based on the TTL value in received fragments. Again, like errors and discards, occasional reassembly failures should not be a reason for concern. In all three cases, accumulated counts that are a significant percentage of the total IP packets received or that rapidly accumulate should cause you to investigate why this is occurring. The following list describes various netstat command options:
The following three options provide subset information of what is displayed with the -a option:
See Figure 13.5 for an example of the statistics displayed by netstat -s. Figure 13.5. Netstat displays protocol-by-protocol statistics.
NbtstatThe nbtstat (NetBIOS over TCP/IP statistics) utility provides statistics about NetBIOS over TCP/IP (see Hour 11). Nbtstat allows you to view the NetBIOS name table on the local computer or on a remote computer. The following command options are used in relation to the local computer:
See Figure 13.6 for examples of these outputs. Figure 13.6. Nbtstat commands and responses.
The nbtstat command can also be used to view the NetBIOS name table of remote computers. The output is similar to nbtstat -n on the local computer.
Similarly, two other nbtstat command options enable you to view the list of NetBIOS connections that a remote computer has open. This list is called a connections table:
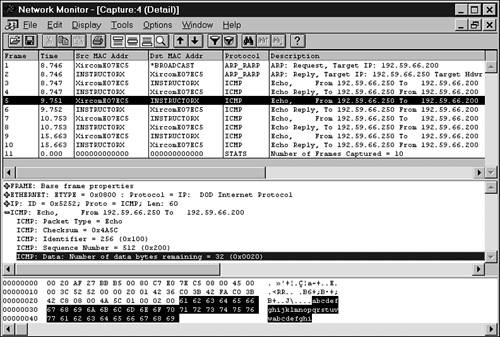
Packet SniffersUtilities known as sniffers capture data from the network into a buffer or a file. After the data is captured, you can display the contents one frame or datagram at a time. Packet sniffers are useful for analyzing subtle network-excessing traffic. You can also use sniffers to find the source of corrupt packets that might have come from a malfunctioning device. You can trace an ethernet frame by its physical address. You can analyze header information from any protocol level (see Hours 3, "The Network Access Layer," 4, and 6) to look for clues. Figure 13.7 shows the sequence of 10 datagrams that was initiated by entering a ping command. The top window shows the 10 datagrams starting with an ARP request and an ARP reply followed by four ICMP request/reply pairs. The middle window decodes the ICMP header, and in the bottom frame you can see the 32 bytes of data in the datagram. The data includes the complete alphabet followed by the letters abcdef, for a total of 32 bytes of data. Figure 13.7. A view of traffic captured by Microsoft's Network Monitor utility following a ping command.
|
|
|
Source code editor
Website development