|
|
↑
By using this debugger, you can look deep into the code as it runs. It will allow you run the code, one line at a time, and each time, either adding extra code on the fly (without editing the original file), or checking how variables change in the run of the program. Note! JavaScript Debugger can debug only pure JavaScript code. If your script contains identification of browser (f.e Starting Debugger.If open document is JavaScript file, Web page which contains embedded scripts or selected text is JavaScript, click Debug (Ctrl+D) from Debugging Toolbar or Debugging Menu to start running JavaScript Debugger. Once Debuger has started up, it should look something like below.  Panel called "Source code" contains loaded code from current document. You can close a tab and reopen code by double-clicking corresponding line in the "Loaded Scripts" panel. Output panelOutput panel contains output window, which displays results of 
Go a little further, and declare something, say Num (set it to 133): 
Since this is JavaScript, you not only declare variables, and do basic Math, you can use objects from JavaScript, such as the String class. Enter 
If you want, you can also try to execute a function or get (set) a variable current value. SteppingThe various buttons are, "Step over", "Step into" and "Step out". You can mouse over these buttons to get a tooltip. Press multiple times the buttons "Step Into" (F11), "Step Over" (F12) or "Step Out" (F10 if the current line is inside the function). You will see the results of debugging in the "Output" panel, current values of variables in the "Variables" tab and executing functions in the "Call Stack" tab. Watches list
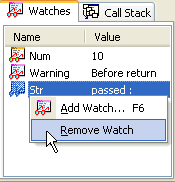
Here, you can enter various variables, and as you step through your code, it will update to reflect the value of that variable/property as it changes through the code. So in a way, it acts like the Variables panel, just without all the stuff you don't want to see.
BreakpointsUsing only stepping has its drawback. By stepping, you're forced to step through all the steps of a script and if you decide you wanted a stop here or there you need breakpoints. ConclusionThis debugger is very convenient for debugging JavaScript code. But I repeat one more time, if your script contains identification of browser or page properties, you should debug your document in the corresponding browser’s debugger (e.g Microsoft Script Debugger or Venkman).
→ |


